Debugging Guide for PHP Developers
Tools that can benefit your debugging process


Table of contents
Introduction
This article covers some tools that can help you as a PHP developer. If you are using var_dump() and print_r() every time you try to debug your code, this article will help you save a lot of time at debugging.
What is debugging?
The term "debugging" refers to an action that requires the developer to identify a problem and correct it. While developing a product, it's normal to have some features behave incorrectly. You will need to debug and fix issues in your code continuously.
You can do debugging with tools and techniques. In this article, you will learn about some tools that you can use to debug your code.
PHP DebugBar
While working on the front-end, you generally use the Developer Tools provided by the browser. PHP DebugBar is something like the Developer Tools, but for the backend.
You can dump variables and messages inside your code, and they won't show up on the webpage. Rather, they will show up in the debug bar below the screen.
A few more things you can do:
You can monitor your requests.
You can see your application's exceptions in the Exception tab.
You can monitor your page loading time and memory consumption.
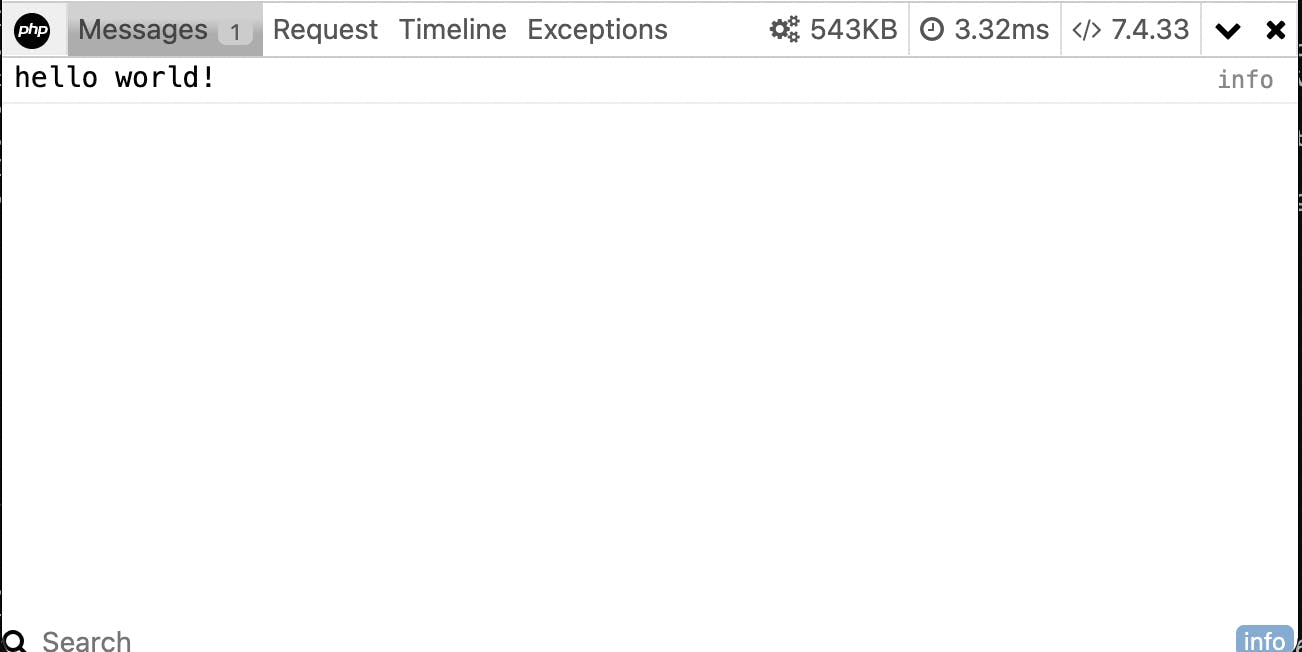
Here is a short example of how you can use PHP DebugBar.
use DebugBar\StandardDebugBar;

$debugbar = new StandardDebugBar();
$debugbarRenderer = $debugbar->getJavascriptRenderer();

$debugbar["messages"]->addMessage("hello world!");
?>
<html>
<head>
    <?php echo $debugbarRenderer->renderHead() ?>
</head>
<body>
    ...
    <?php echo $debugbarRenderer->render() ?>
</body>
</html>
When you open this page in the browser, here is how you can see the message.
Kint
You prefer using var_dump() and print_r()? Here's a great tool that can help you.
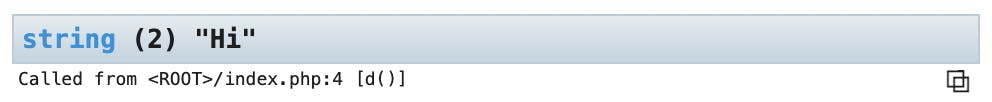
Kint presents a styled, collapsible output of variables. It's very easy to use and integrate. It also shows the file and the line where you dumped the variable(s). You can disable Kint's dumpings in your code very easily.
d('Hi');
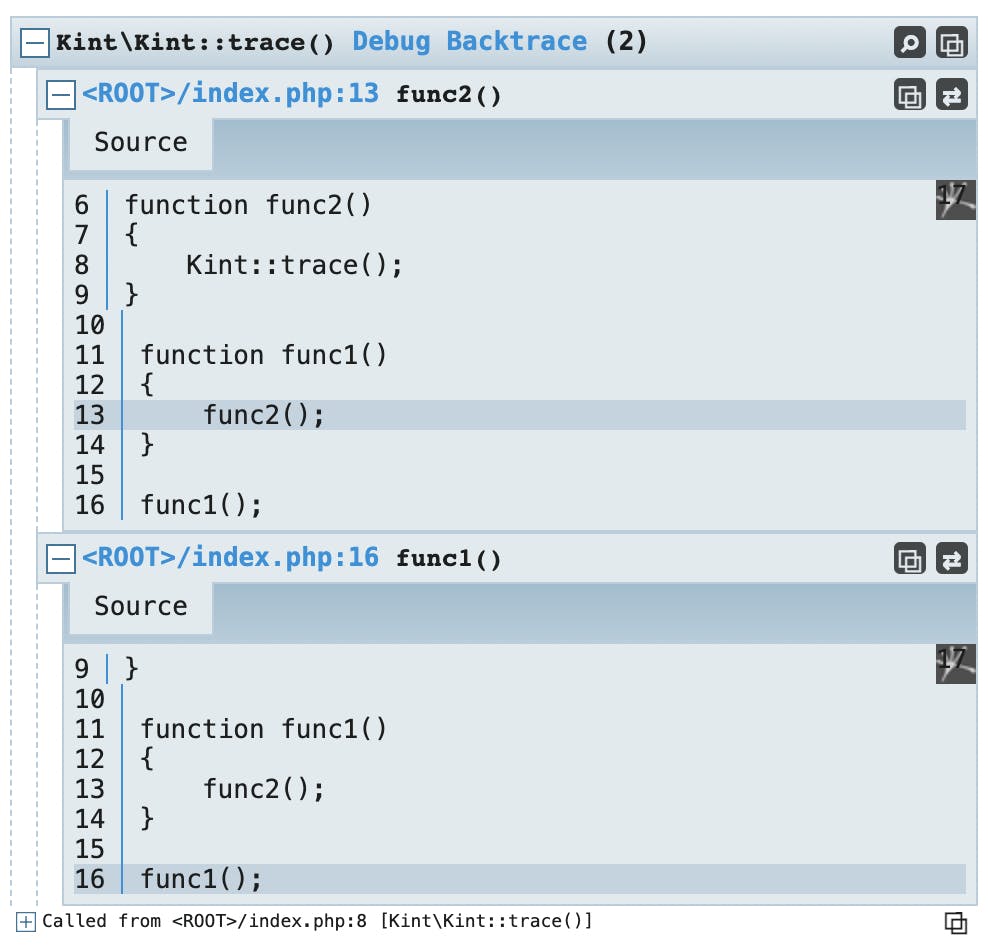
Let's try printing a trace.
use Kint\Kint;

function func2()
{
    Kint::trace();
}

function func1()
{
    func2();
}

func1();
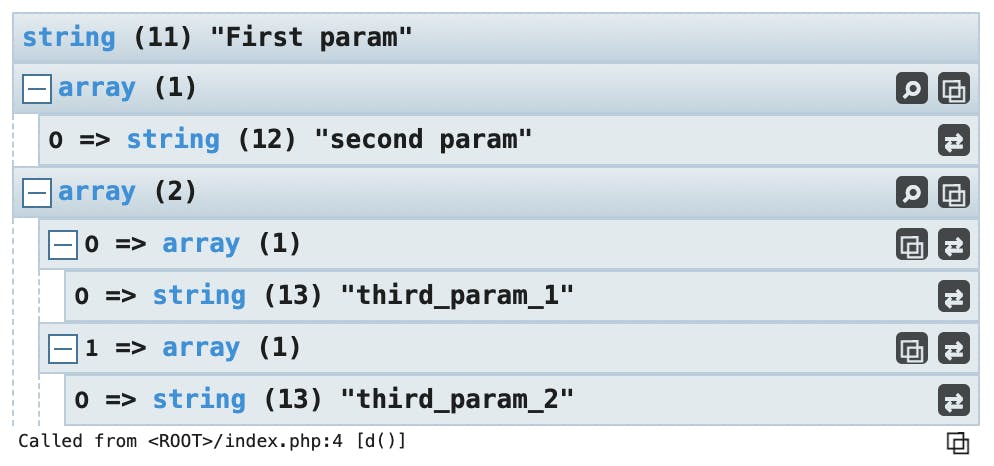
How does it display multi-dimensional arrays?
d(
    "First param",
    ['second param'],
    [ ['third_param_1'], ['third_param_2'] ]
);
Source: kint-php.github.io/kint
Xdebug
Thinking about debugging your code with breakpoints and analyzing your code's performance? Xdebug is your best friend!
This is a tool that has everything you need for debugging your code. You can use it by installing its extension in your editor or IDE like VSCode, VIM, PHPStorm, etc.
Here's a quick demonstration of how you can use Xdebug.

Conclusion
Each of these three debugging tools serves different purposes. Try these out and keep your code bug-free more than ever.
Thanks for reading! If you enjoyed this article, please hit the "Like" button and share it with your network.
Don't miss out on my future articles - follow me on Hashnode and Substack.